Total trade turnover: $8,466.6 millions
As of Dec 2015 the total cumulative trade turnover decreased by 23.1% (USD 2,544.6 millions) from that of the previous year and reached USD 8,466.6 millions. The decrease in the trade turnover was mainly due to the decrease in imports by USD 1,439.5 millions. The structure of the trade flows with the neighboring trade partners is as following: (i) trade with PRC: 62.1% or USD 5,257.9 millions and (ii) trade with Russia: 13.0% or USD 1,098.0 millions. The trade volume between Mongolia and China decreased by 22.7% and the trade volume between Mongolia while Russia decreased by 31.8%.
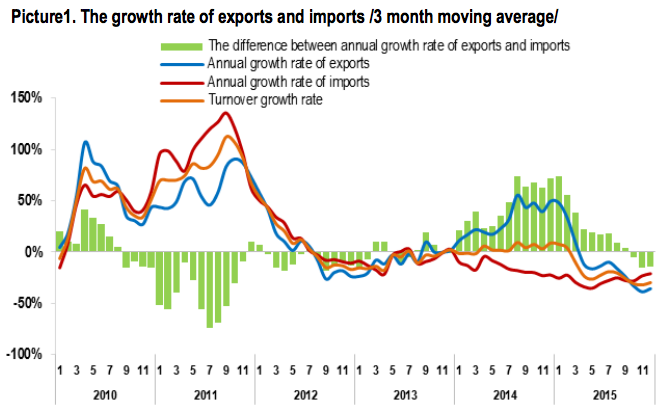
Trade balance: $872.3 million
As of Dec 2015, the cumulative trade balance improved by USD 334.4 millions from that of the previous year and reached USD 872.3 millions. During the reporting period even though the total exports decreased by 19.1% from that of the previous year, imports decreased by 27.5% from that of the previous year, thus the trade balance improved by USD 334.4 millions. The three-month moving average value of the difference between annual growth rates of exports and imports started to decline since the beginning of 2015. The high export growth rate during 2014 was due to the exports of copper concentrate and it started to stabilize.
EXPORT: Composition: 87% + 13%
The share of mineral exports in total exports declined by 2% from that of the previous year. Exports of coal, copper concentrate, iron ore and concentrate and crude oil have a weight of nearly 74% of total exports and 85% of mining exports. In addition, these 4 products’ share in the mining exports decreased by 3.0 points from that of the previous year, share in the total exports decreased by 4.0 points. Mongolian export decreased by 19.1% from that of the previous year, which was mainly affected by decrease in commodity prices. Exports of non-monetary gold increased by 4%, which accounted for 0.3% in growth of mining export. On the other hand, coking coal, copper concentrate, iron ore and crude oil export decreased by nearly 35%, 11%, 49% and 39% respectively, which accounted for 21% decrease in the growth of mining export.
Growth: -19.1%
Mongolian export decreased by 19.1% from that of the previous year, which was mainly affected by decrease in commodity prices. Exports of non-monetary gold increased by 4%, which accounted for 0.3% in growth of mining export. On the other hand, coking coal, copper concentrate, iron ore and crude oil export decreased by nearly 35%, 11%, 49% and 39% respectively, which accounted for 21% decrease in the growth of mining export.
 Changes
As of Dec 2015, Mongolian export decreased by 1,105.1 million USD from that of the previous year. It is affected by the increase of export commodities’ quantities (USD 76.6 millions) and decrease in export commodities’ prices (USD 1,181.7 millions) . Because of the increase in quantity of crude oil, nonmonetary gold and copper concentrate export, mining export increased by 354 millions USD. On the other hand, because of decrease in prices of mineral exports, mining export declined by 1,181.7 million USD. Cashmere, cashmere products’ export decreased by 48 million USD, while other exports increased by 5 million USD.
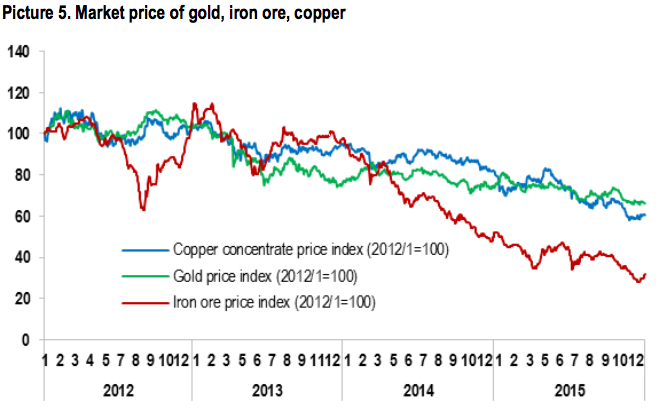
World market prices for primary commodities
As of Dec 31 2015, gold price reached 1,061.1 USD, decreased by 10.4% from that of the previous year and decreased by 0.3% from that of the last month. As of Dec 31 2015, copper and iron ore prices reached 4,705.8 USD and 44.0 USD respectively. Copper price decreased by 26.1% from that of previous year and increased by 2.3% from that of previous month. Iron ore price decreased by 36.2% from that of previous year and remained at the same level from that of previous month.
IMPORT: Composition: 29% + 38% + 19%
As of Dec 2015, 29% of total imports were consumer goods, 38% were capital goods and 19% were fuels. Share of the capital goods in total imports decreased by 2% from that of the previous year, while the share of consumer goods import increased by 3%.
Growth: -27.5%
Mongolian imports decreased by 27.5% from that of the previous year. Main contributors of this decrease were capital goods decrease, which equals to 12% of the total decrease and fuel imports which equals to 9% of the total decrease. Capital goods and petroleum products imports decreased by 31% (654 millions USD) and 39% (447 millions USD) respectively. Thus total import decreased from that of the previous year.
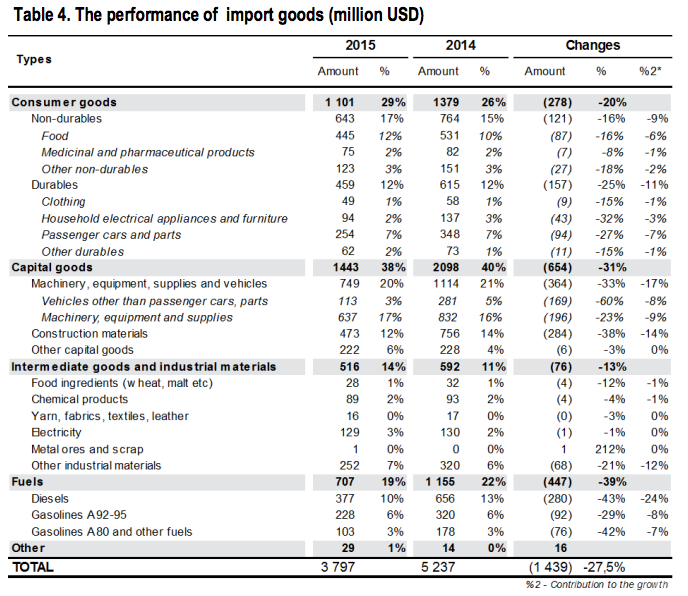
Breakdown
Main contributors of decrease in consumer goods import were both in durables and non-durables. Passenger cars import decreased by 27% (94 millions USD) and foods import decreased by 16% (87 millions USD).
Capital goods import decreased by 31% (654 millions USD) which was mainly contributed by 33% decrease in machinery, equipment and supplies (364 million USD). In addition, import of construction materials decreased by 38% (284 million USD) from that of previous year.
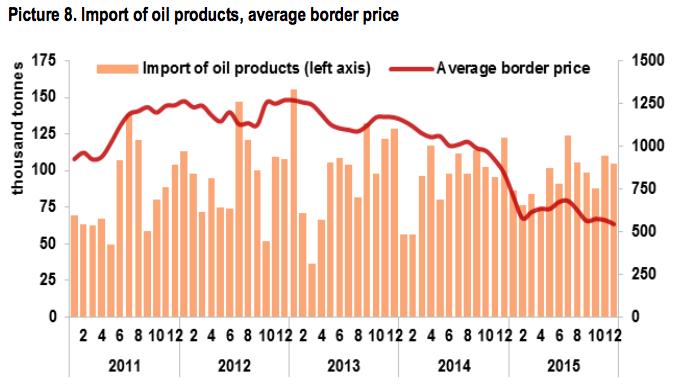
Intermediate goods and industrial materials import decreased by 13% (76 millions USD). Fuels import decreased by 39% (447 millions USD). The border price of oil has been decreasing since the end of 2013. In parallel with global oil market price, it declined sharply during last half year.
Import of the consumer goods
The growth of consumer goods import, calculated by 3 month moving average method, is constantly declining. /Figure 7/. Even though, the import growth of non-durable consumer goods was relatively stable, it started to decline by bigger phase in last 6 months.
Total trade turnover: $8,466.6 millions
As of Dec 2015 the total cumulative trade turnover decreased by 23.1% (USD 2,544.6 millions) from that of the previous year and reached USD 8,466.6 millions. The decrease in the trade turnover was mainly due to the decrease in imports by USD 1,439.5 millions. The structure of the trade flows with the neighboring trade partners is as following: (i) trade with PRC: 62.1% or USD 5,257.9 millions and (ii) trade with Russia: 13.0% or USD 1,098.0 millions. The trade volume between Mongolia and China decreased by 22.7% and the trade volume between Mongolia while Russia decreased by 31.8%.
Trade balance: $872.3 million
As of Dec 2015, the cumulative trade balance improved by USD 334.4 millions from that of the previous year and reached USD 872.3 millions. During the reporting period even though the total exports decreased by 19.1% from that of the previous year, imports decreased by 27.5% from that of the previous year, thus the trade balance improved by USD 334.4 millions. The three-month moving average value of the difference between annual growth rates of exports and imports started to decline since the beginning of 2015. The high export growth rate during 2014 was due to the exports of copper concentrate and it started to stabilize.
EXPORT: Composition: 87% + 13%
The share of mineral exports in total exports declined by 2% from that of the previous year. Exports of coal, copper concentrate, iron ore and concentrate and crude oil have a weight of nearly 74% of total exports and 85% of mining exports. In addition, these 4 products’ share in the mining exports decreased by 3.0 points from that of the previous year, share in the total exports decreased by 4.0 points. Mongolian export decreased by 19.1% from that of the previous year, which was mainly affected by decrease in commodity prices. Exports of non-monetary gold increased by 4%, which accounted for 0.3% in growth of mining export. On the other hand, coking coal, copper concentrate, iron ore and crude oil export decreased by nearly 35%, 11%, 49% and 39% respectively, which accounted for 21% decrease in the growth of mining export.
Growth: -19.1%
Mongolian export decreased by 19.1% from that of the previous year, which was mainly affected by decrease in commodity prices. Exports of non-monetary gold increased by 4%, which accounted for 0.3% in growth of mining export. On the other hand, coking coal, copper concentrate, iron ore and crude oil export decreased by nearly 35%, 11%, 49% and 39% respectively, which accounted for 21% decrease in the growth of mining export.
Changes
As of Dec 2015, Mongolian export decreased by 1,105.1 million USD from that of the previous year. It is affected by the increase of export commodities’ quantities (USD 76.6 millions) and decrease in export commodities’ prices (USD 1,181.7 millions) . Because of the increase in quantity of crude oil, nonmonetary gold and copper concentrate export, mining export increased by 354 millions USD. On the other hand, because of decrease in prices of mineral exports, mining export declined by 1,181.7 million USD. Cashmere, cashmere products’ export decreased by 48 million USD, while other exports increased by 5 million USD.
World market prices for primary commodities
As of Dec 31 2015, gold price reached 1,061.1 USD, decreased by 10.4% from that of the previous year and decreased by 0.3% from that of the last month. As of Dec 31 2015, copper and iron ore prices reached 4,705.8 USD and 44.0 USD respectively. Copper price decreased by 26.1% from that of previous year and increased by 2.3% from that of previous month. Iron ore price decreased by 36.2% from that of previous year and remained at the same level from that of previous month.
IMPORT: Composition: 29% + 38% + 19%
As of Dec 2015, 29% of total imports were consumer goods, 38% were capital goods and 19% were fuels. Share of the capital goods in total imports decreased by 2% from that of the previous year, while the share of consumer goods import increased by 3%.
Growth: -27.5%
Mongolian imports decreased by 27.5% from that of the previous year. Main contributors of this decrease were capital goods decrease, which equals to 12% of the total decrease and fuel imports which equals to 9% of the total decrease. Capital goods and petroleum products imports decreased by 31% (654 millions USD) and 39% (447 millions USD) respectively. Thus total import decreased from that of the previous year.
Breakdown
Main contributors of decrease in consumer goods import were both in durables and non-durables. Passenger cars import decreased by 27% (94 millions USD) and foods import decreased by 16% (87 millions USD).
Capital goods import decreased by 31% (654 millions USD) which was mainly contributed by 33% decrease in machinery, equipment and supplies (364 million USD). In addition, import of construction materials decreased by 38% (284 million USD) from that of previous year.
Intermediate goods and industrial materials import decreased by 13% (76 millions USD). Fuels import decreased by 39% (447 millions USD). The border price of oil has been decreasing since the end of 2013. In parallel with global oil market price, it declined sharply during last half year.
Import of the consumer goods
The growth of consumer goods import, calculated by 3 month moving average method, is constantly declining. /Figure 7/. Even though, the import growth of non-durable consumer goods was relatively stable, it started to decline by bigger phase in last 6 months.